A Practical Guide to False Data Injection in Islanded AC Microgrids
Deep learning approach for detecting False Data Injection Attacks in grid-connected and islanded microgrid operations.
KEYWORDS
False Data Injection Attacks, LSTM, Microgrid Security, IEEE 33-Bus System, Anomaly Detection
Overview
As microgrids become a cornerstone of smart energy infrastructure — especially in Internet of Energy (IoE) settings — their cyber-physical attack surface grows with them. This project investigates a particularly dangerous attack class: False Data Injection (FDI) attacks targeting the active power measurements of inverter-based islanded microgrids, and builds a simulation framework to study their physical consequences and detectability.
The Problem
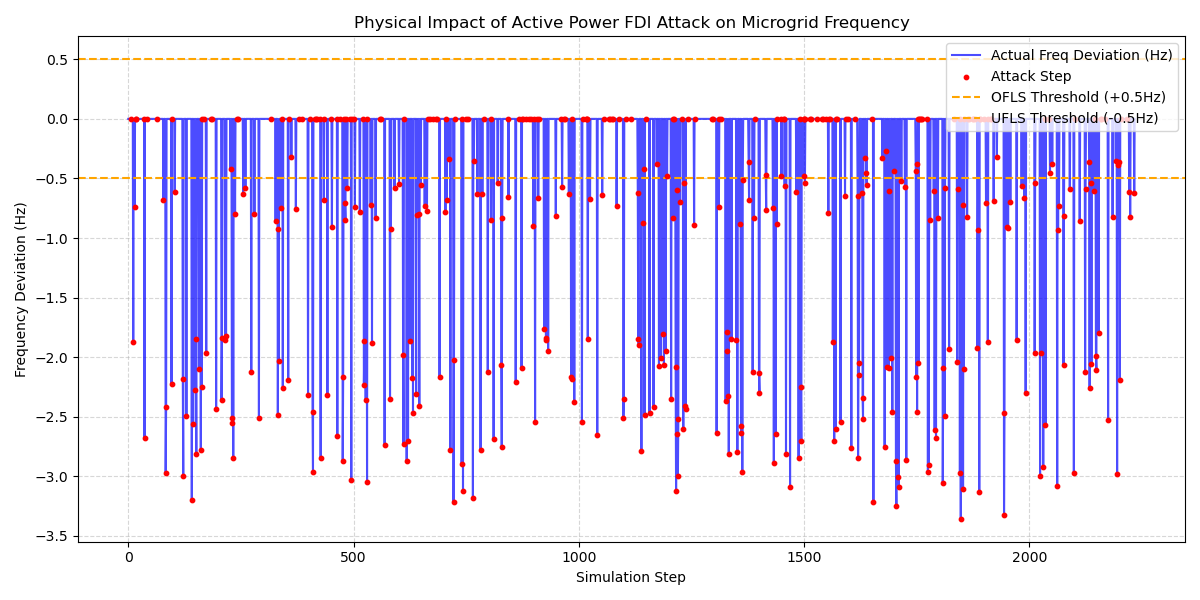
In an islanded microgrid, inverters regulate frequency through AC droop control — a mechanism where each Distributed Energy Resource (DER) adjusts its power output based on the system frequency. If an attacker can falsify the active power measurements fed to the droop controller, they can trick it into issuing incorrect frequency setpoints, causing real, physical frequency deviations that may trigger Under/Over Frequency Load Shedding (UFLS/OFLS) — disrupting supply to critical loads.
The critical challenge: such attacks must be stealthy, bypassing standard Weighted Least Squares (WLS) Bad Data Detection (BDD) used in state estimation.
The Approach
1. Attack Simulation (SimulateIsland.m)
Built on the IEEE 33-bus test system (modified for islanded operation with bus 34 removed to open the Point of Common Coupling), the MATLAB simulation:
- Closes the droop control loop iteratively — DER setpoints are updated based on computed frequency until convergence, making the simulation physically accurate.
- Builds a proper H measurement matrix from AC power flow Jacobians (
dSbus_dV,dSbr_dV) covering all bus injections and branch flows for full observability. - Crafts stealthy FDI attacks using the relation
z_attacked = z_true + H·c, wherecis a carefully constructed state perturbation. This guarantees the corrupted measurement vector lies in the column space of H, making it indistinguishable from a legitimate operating point under WLS BDD. - Quantifies real physical impact: after injecting falsified measurements, the attacked droop controller recomputes setpoints, a second AC power flow is solved, and the resulting true frequency deviation is logged.
- Logs load shedding events (UFLS at −0.5 Hz, OFLS at +0.5 Hz) per simulation step.
Over 5,000 simulation steps (500 warmup excluded), approximately 20% of steps are randomly designated as attack scenarios, producing a labeled dataset for downstream analysis.
2. Data Preprocessing (DataPreprocessing.py)
Real-world load profiles are sourced from the UCI Individual Household Electric Power Consumption Dataset (IHEPCDS) and mapped to the 11 load buses of the IEEE 33-bus system. The preprocessing pipeline cleans raw data, strips irrelevant columns, and splits readings into 11 parallel time-aligned segments — giving the simulation realistic, time-varying demand profiles.
3. Validation & Analysis (AdvancedValidationPlots.py, VisualizeImpact.py)
Three key research plots are generated:
| Plot | What it Shows |
|---|---|
| Stealthiness Validation | WLS residuals (J_attack) vs. dynamic BDD threshold (τ) on a log scale — confirming attacks remain below the detection boundary |
| Attack Precision | Scatter of designed frequency deviation vs. actual physical deviation — validating the closed-loop attack model’s fidelity |
| Statistical Impact | Distribution of frequency deviations during normal operation vs. attacks, with UFLS threshold overlay |
Key Results
- Attacks consistently remain below the WLS BDD detection threshold, validating the Jacobian-based stealth construction.
- The closed-loop model confirms that falsified sensor data translates into measurable, real frequency deviations — not just perceived ones.
- A significant portion of attack steps push the system past the −0.5 Hz UFLS threshold, demonstrating genuine operational risk.
Tech Stack
| Tool | Role |
|---|---|
| MATLAB + MATPOWER | AC power flow, Ybus/Jacobian computation, WLS state estimation |
| Python (pandas, NumPy, matplotlib) | Data preprocessing, visualization, statistical analysis |
| UCI IHEPCDS Dataset | Realistic household load profiles |
| IEEE 33-Bus System | Standard microgrid test topology |
What I Learned
This project deepened my understanding of the intersection between power system state estimation and cyber-physical security. Constructing physically consistent, stealthy FDI attacks requires careful alignment with the AC power flow model — the same mathematics that makes the grid observable is what an adversary can exploit. Building a closed-loop simulation that captures both the control response and the physical consequence of an attack was the most technically rewarding part of the work.